Every See The Bite feature, explained
One page for each feature and layer in the app, in the same order as the in-app tour. Each page explains what the feature does, how to turn it on, and how to use it. Screenshots are included where available.
New here? Start with the full tutorial, which walks every step in order.
Every tour step and the page that explains it (all 67)
Map
Move around the chart, read the water, and pick your fish.
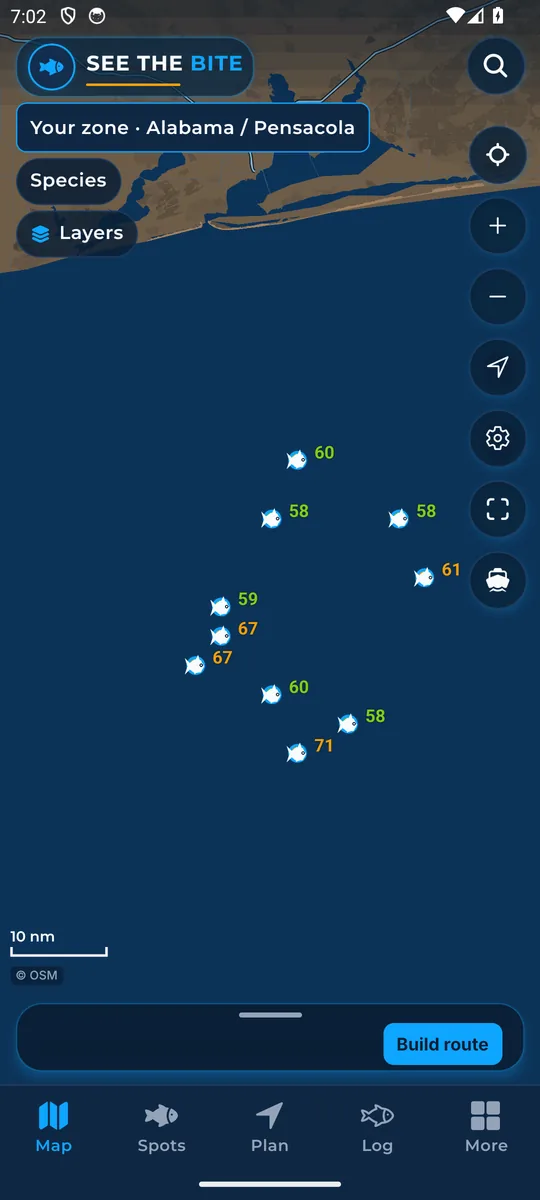
Move the chart
Drag to pan, pinch to zoom, and pull down to refresh the water.
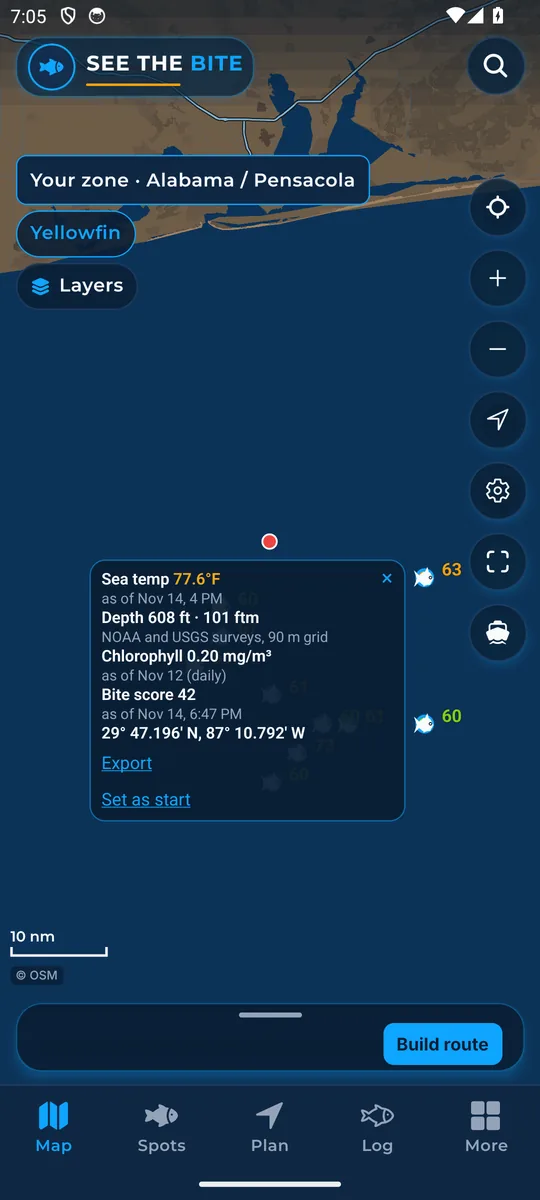
Tap water for a readout
Tap any open water for its position and readings, including clouds and time warnings.
The five tabs
Map, Spots, Plan, Log and More: the bottom bar that switches screens.
Search spots
Find a named spot fast: type a shelf, ledge or fathom line and tap the name.
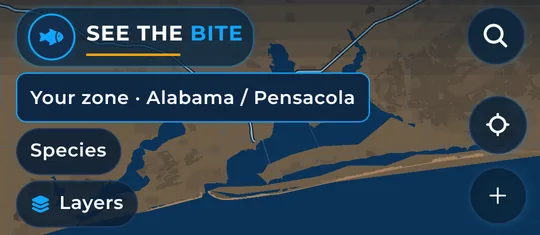
Your zone
The zone chip shows the stretch of coast your trip stays inside.
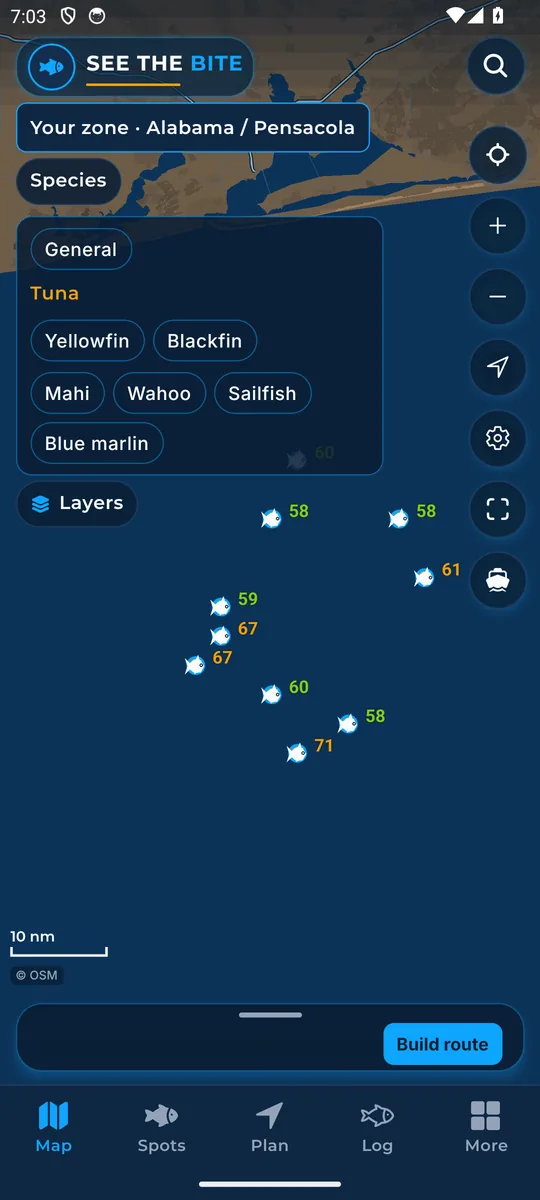
Pick your species
Turn fish on and off. Scores and fish marks follow your picks, with all six species scored throughout launch waters.
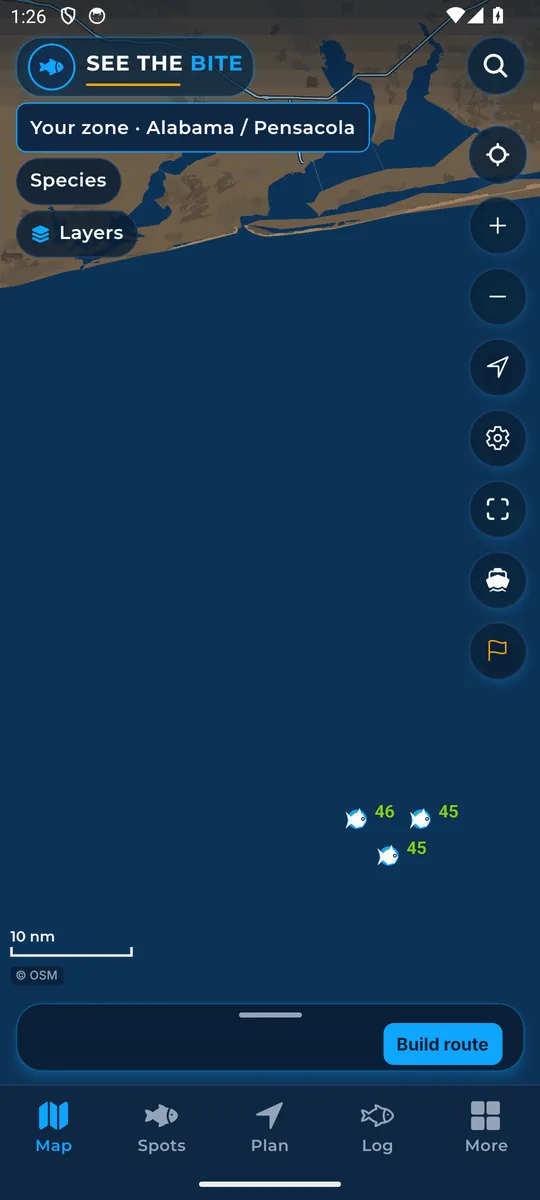
Map buttons
Zoom, center, show where you are, settings, show all, recenter, the sea note flag and the map credit.
Layers
Every layer you can paint on the chart, and how to read it.
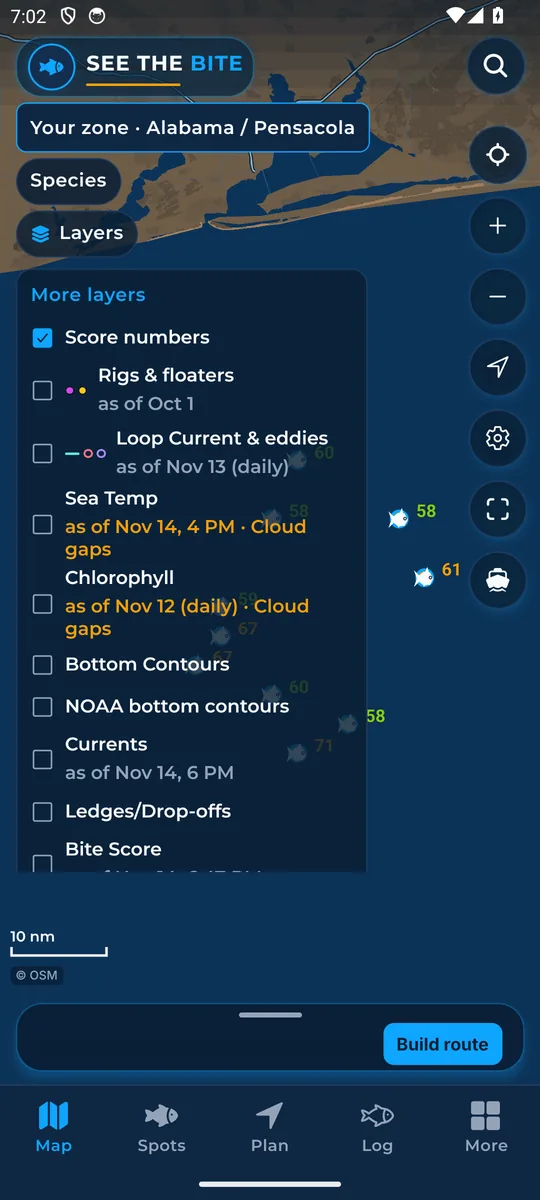
Layers list and More layers
Turn layers on and off from the Layers list, the More layers sheet, or the switches in More.
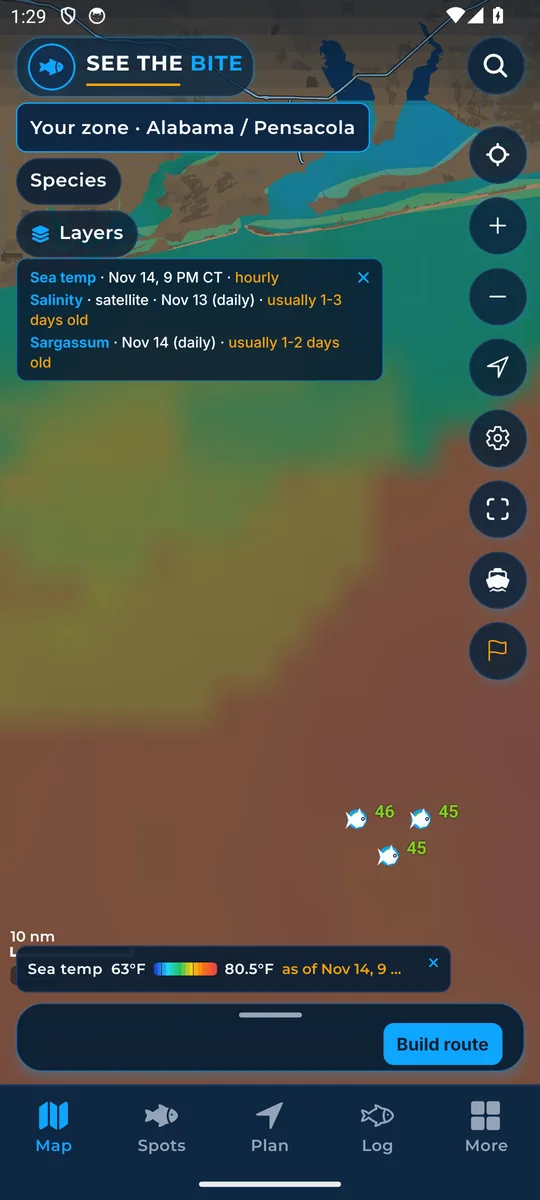
Sea Temp (hourly sea temperature)
The newest satellite sea surface temperature, painted from cooler to warmer.
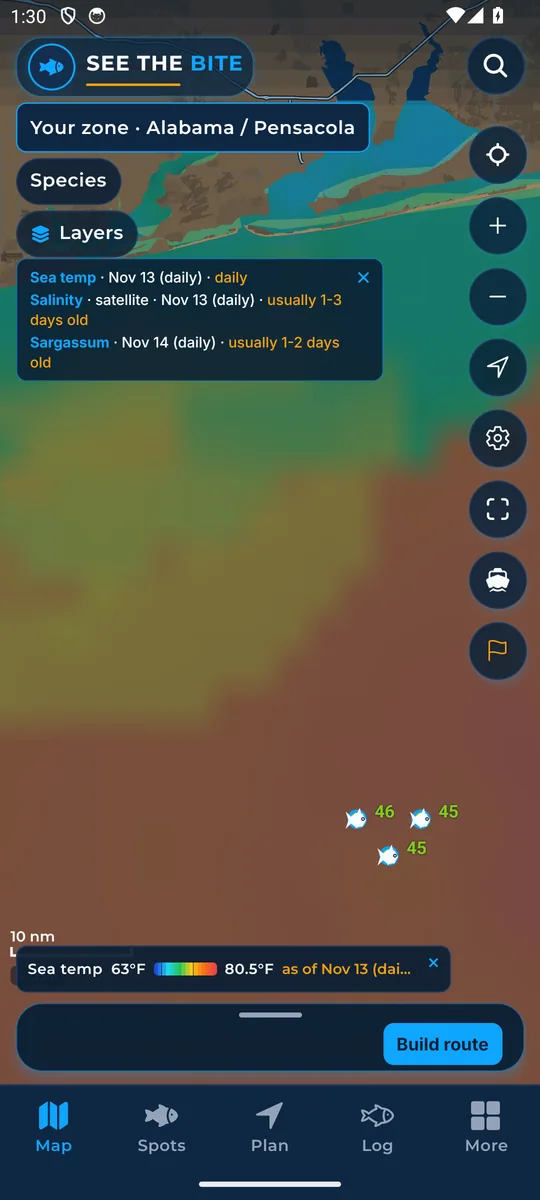
Daily sea temperature
The day view of sea temperature, a wider blended picture about one day old.
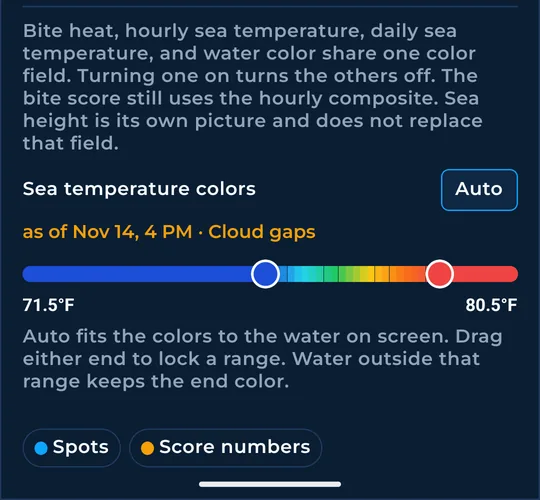
Sea-temp colors (adjustable range)
Lock a low and a high temperature so small breaks stand out.
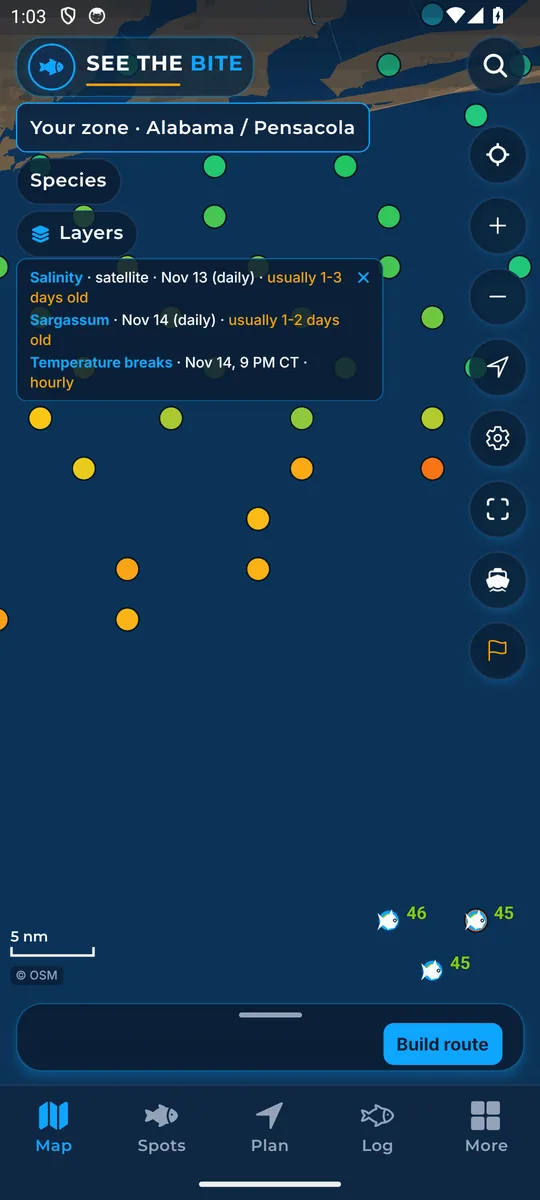
Temperature breaks
Marks where the water temperature changes sharply, where different water meets.
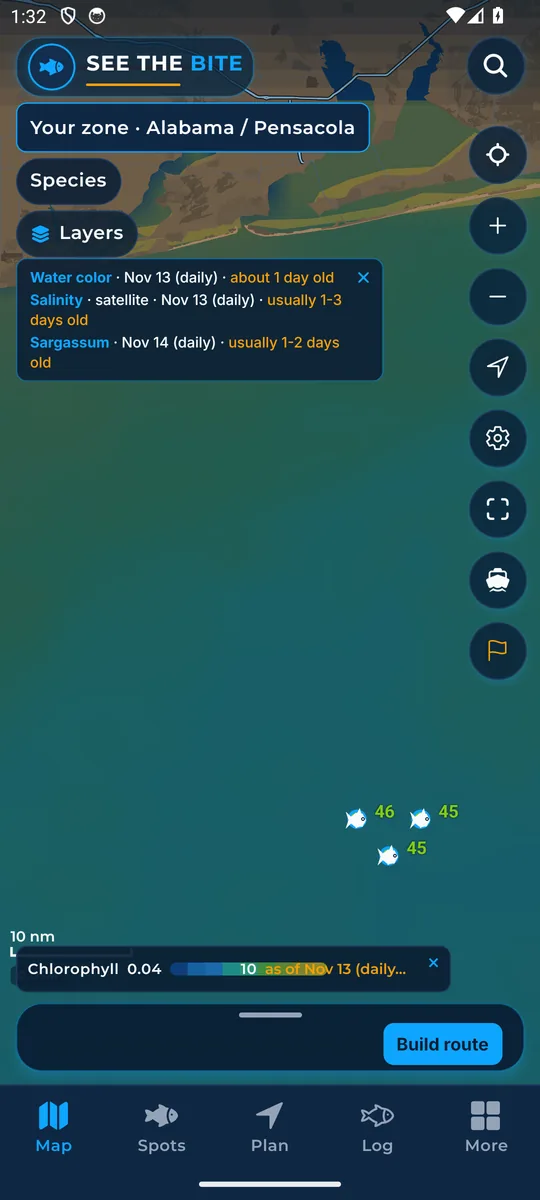
Chlorophyll (water color): Easy or Detailed
Shows where clean blue water meets greener water, the edge where bait often gathers.
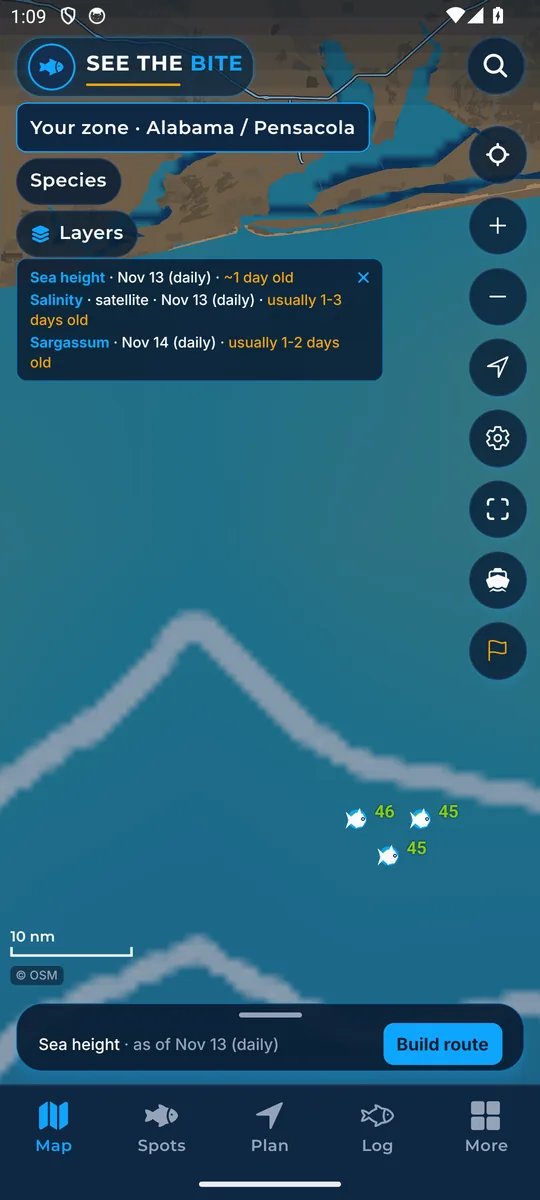
Sea height
Satellite sea height shows eddies, big slow whirlpools whose edges can gather food.
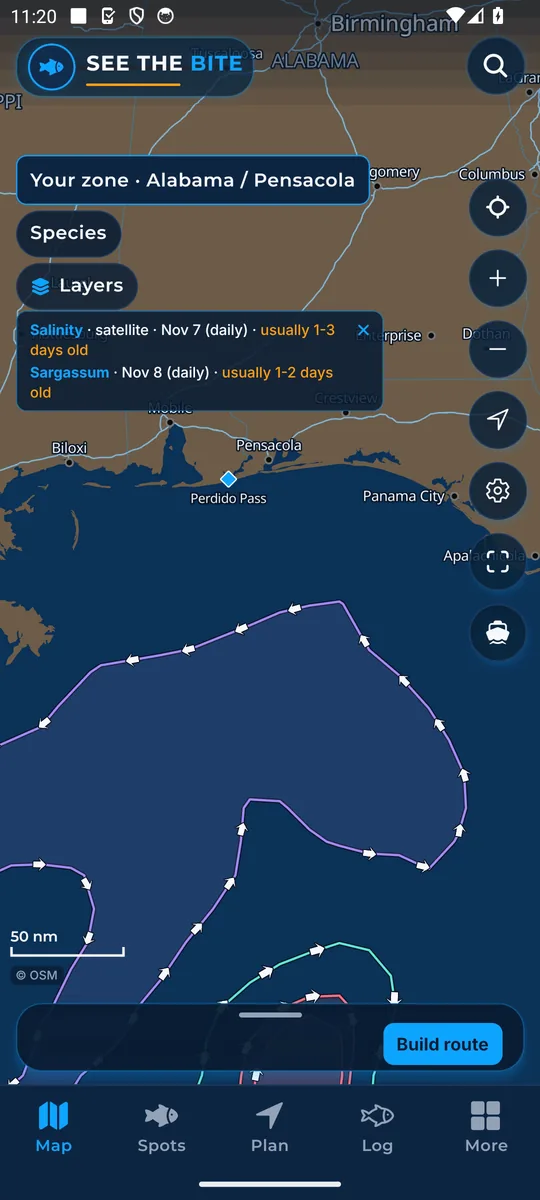
Loop Current & eddies
Draws the edge of the Loop Current and the rings of warm and cold eddies.
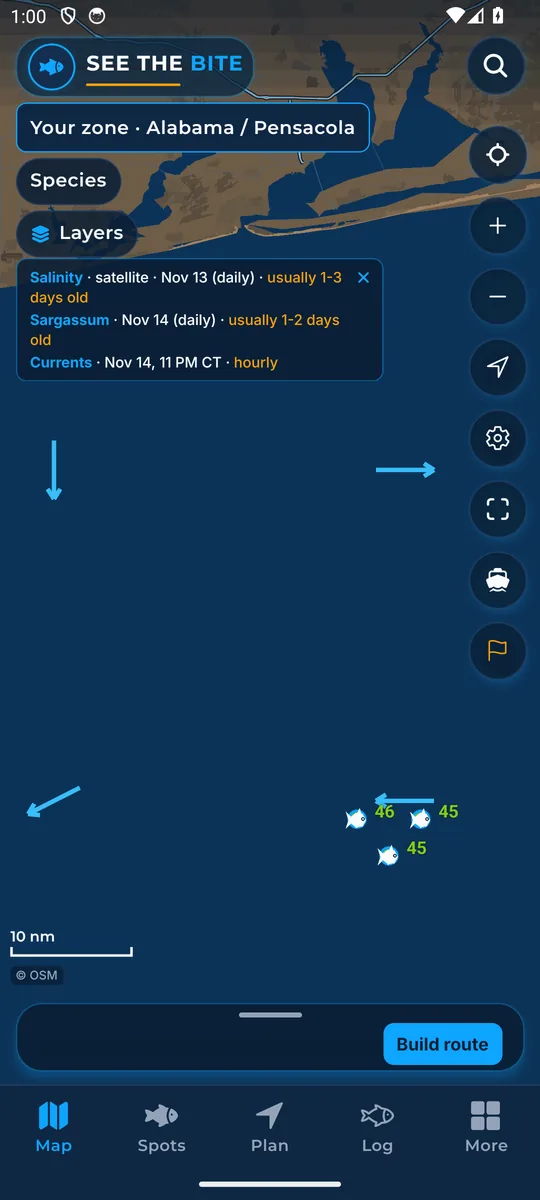
Currents
Arrows show which way the surface water is running.
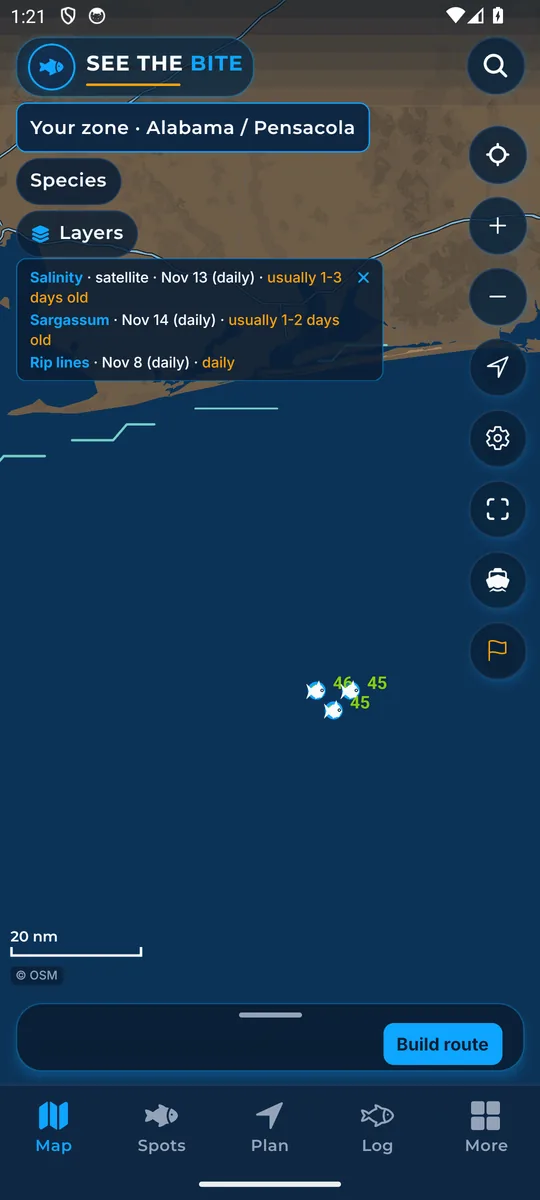
Rip lines
Marks seams where the surface water is pulling apart, where weed lines and slicks form.
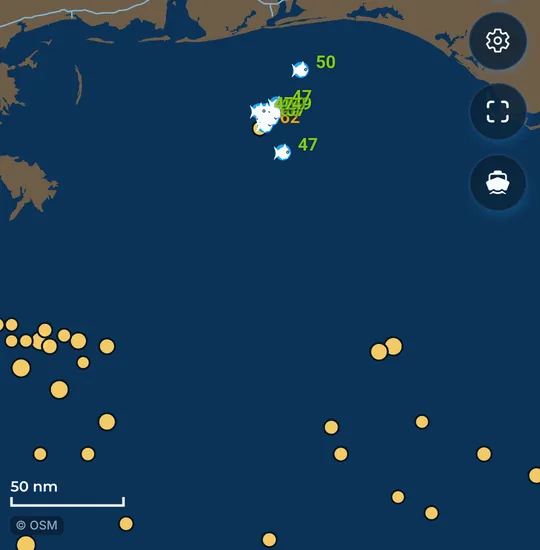
Bait Traps
Dots mark where a rip line meets steep bottom. Bigger dots show a closer match.
Bottom Contours (depth lines)
Depth lines over the water. Close lines mean steeper bottom.
Ledges / Drop-offs
Highlights steep changes in the sea floor, where deep and shallow water meet.
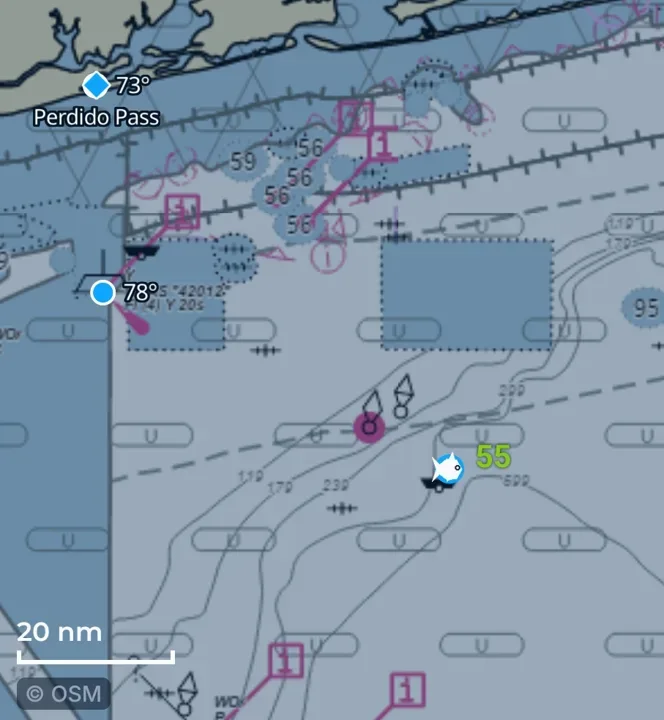
NOAA bottom contours (the chart)
The NOAA nautical chart under the water: chart lines and depth labels.
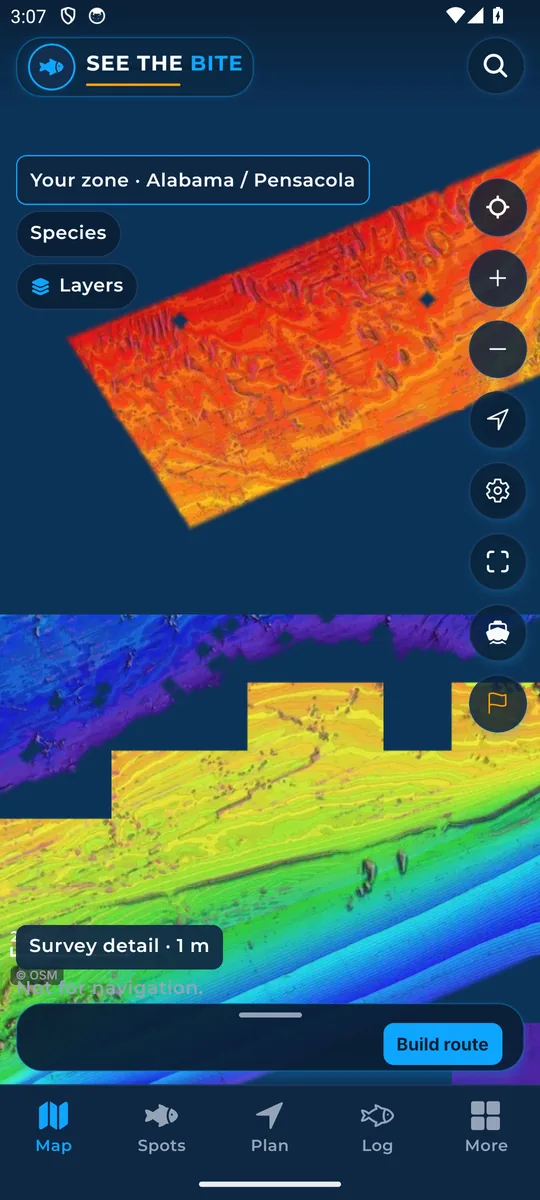
Detailed bottom (shaded relief)
Shaded relief shows ridges, holes and slopes on the sea floor where surveys cover it.
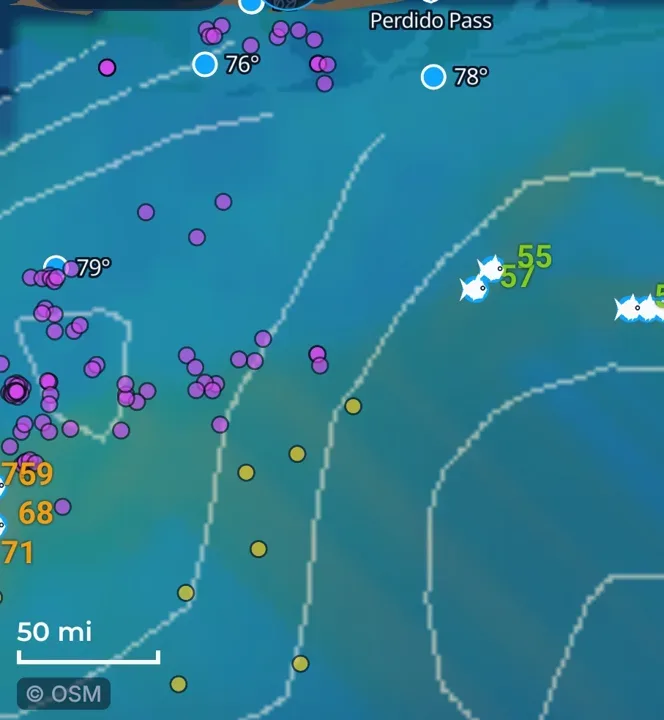
Rigs & floaters
Oil platforms and floating rigs on the chart, each with a score for your fish.
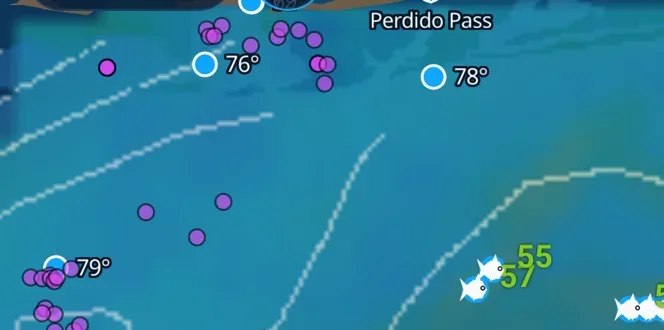
Buoy water temperatures
Real water temperature readings from NOAA buoys and stations.
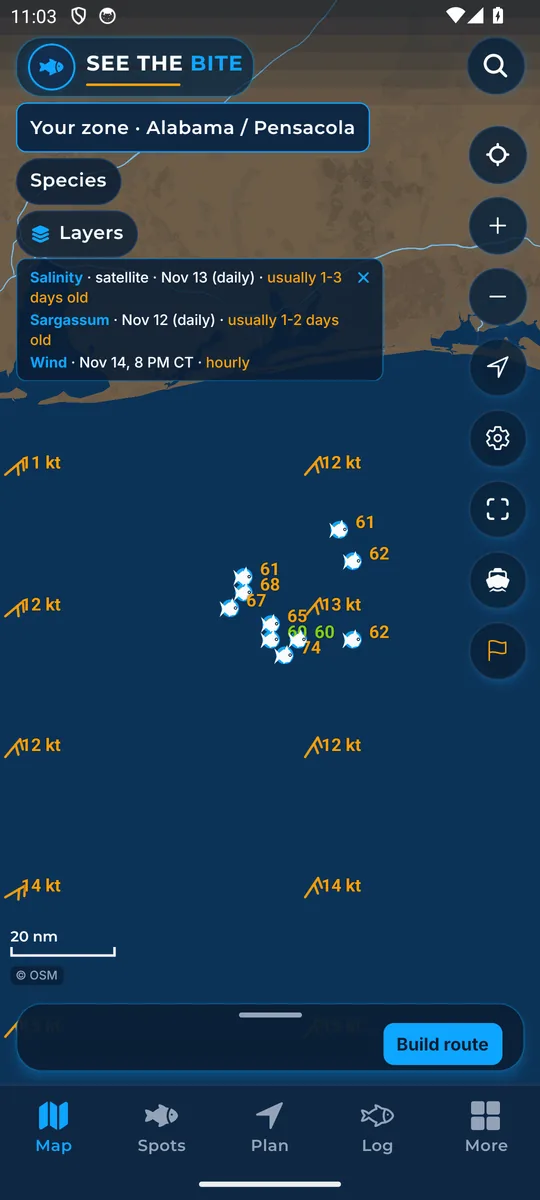
Wind
Wind marks and speeds for the current hour.
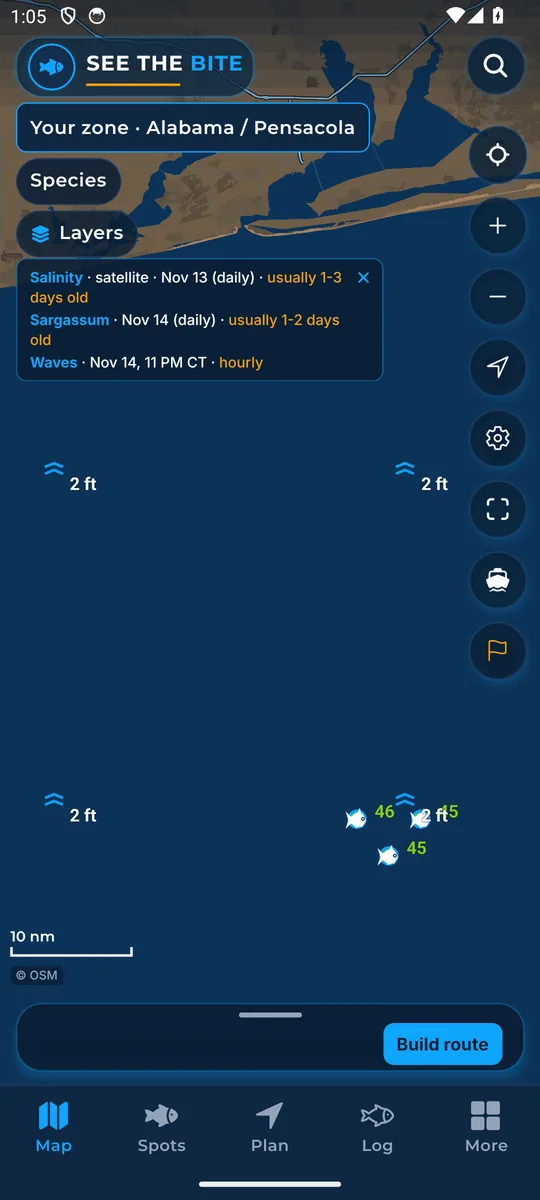
Waves
Wave marks and heights for the current hour.
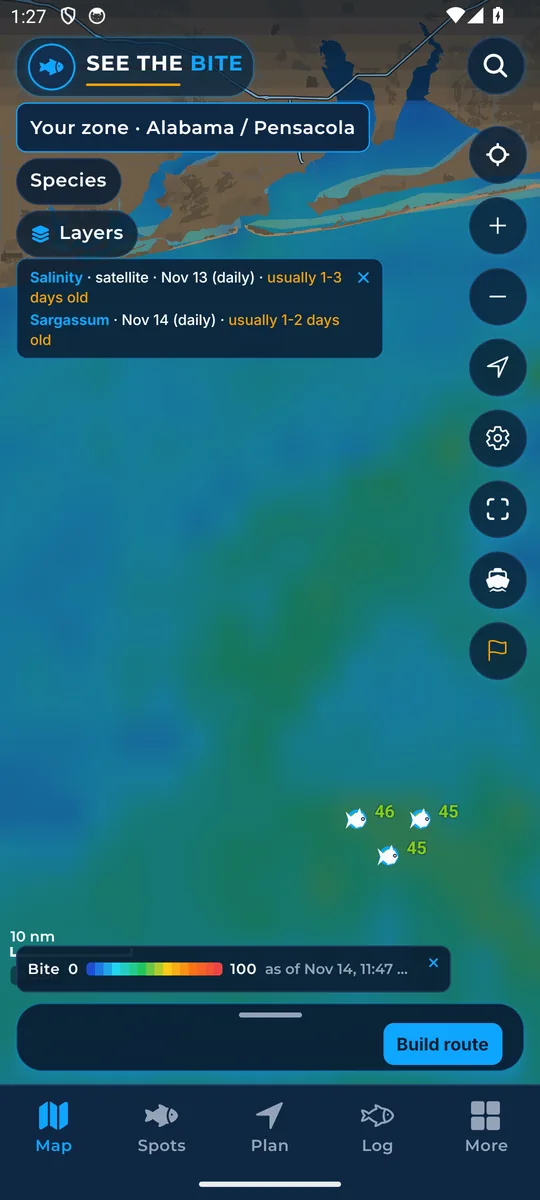
Bite Score heat layer
Paints the 0 to 100 Bite Score as a color field for the fish you picked.
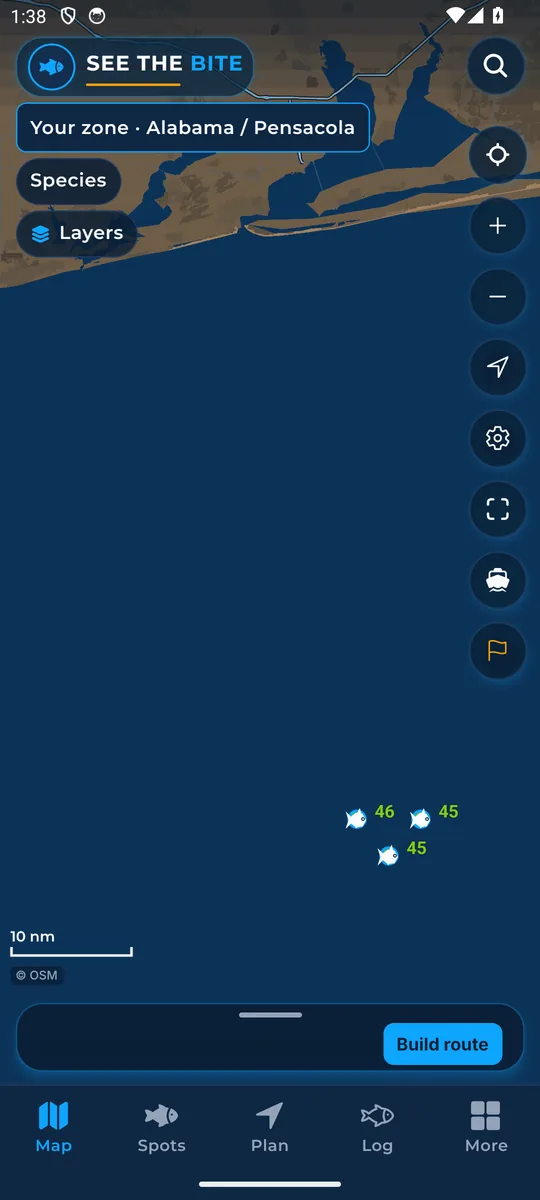
Score numbers
Prints the 0 to 100 score on each fish mark.
Trip route line
The gold line that joins your planned stops and the run home.
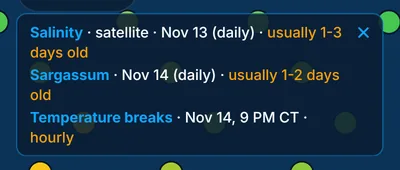
Data as of: how fresh is the water?
Check as-of times where available. Some readings have an unknown time.
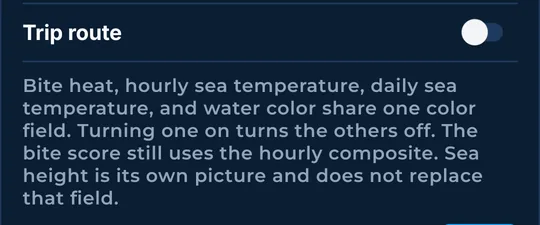
One color field and the legend
Why some layers replace each other, and how to tuck the legend strip away.
Rigs & spots
Fish marks, rigs, pins, and the spots you keep.
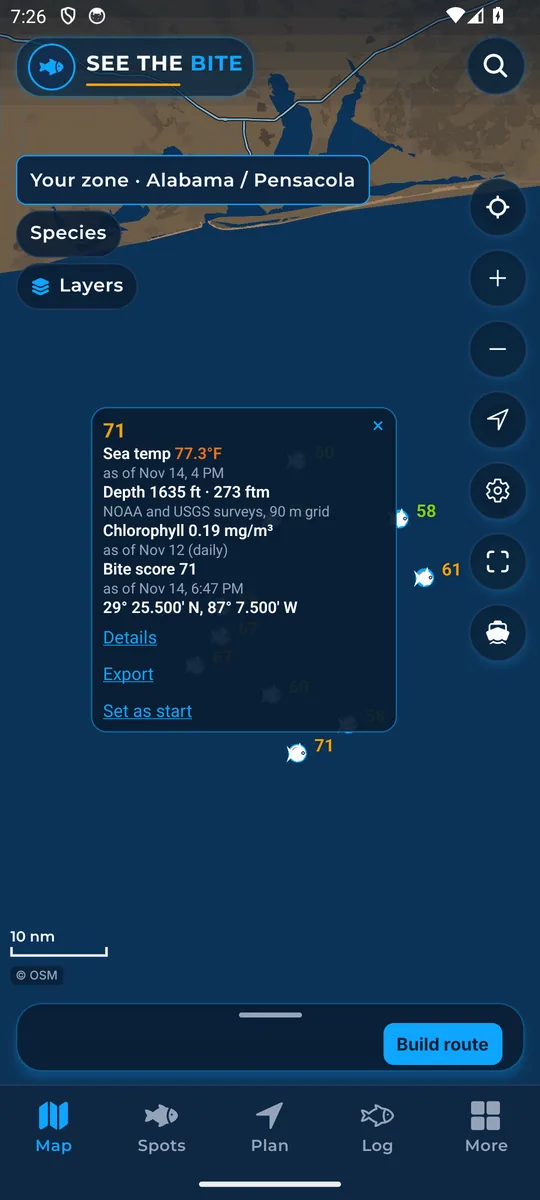
Fish marks and the fish card
Suggested fishing spots appear as fish marks. Tap one for its position, score and Details.
Rig cards: names and scores
Tap a rig or floater for its name and its score for your fish.
Drop a pin
Press and hold to drop a pin, then save it as a named start.
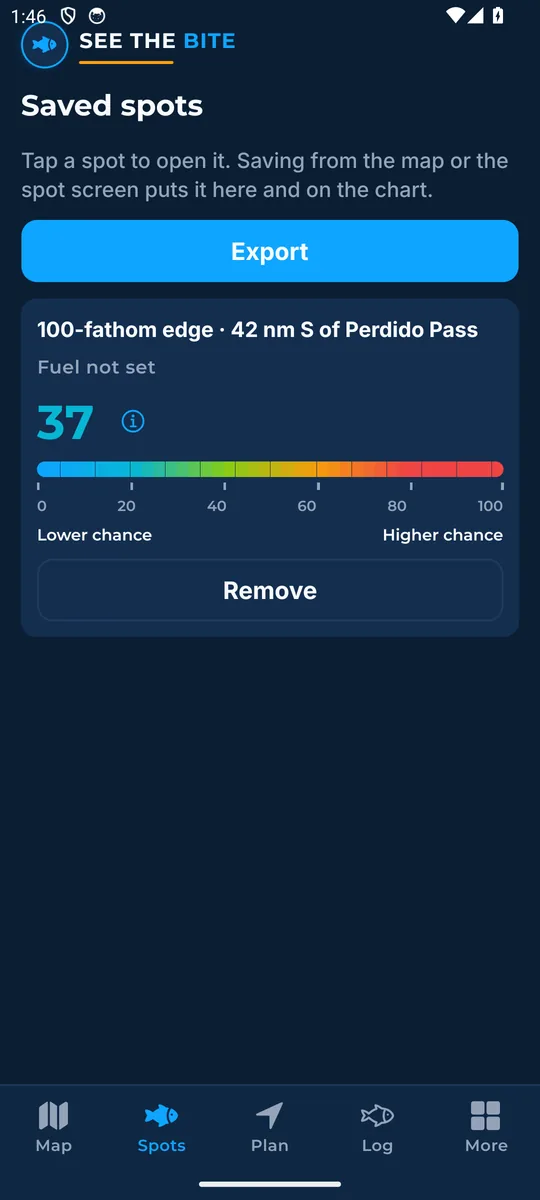
Saved spots
The Spots tab keeps the marks you saved on this phone. Export them all as one GPX file.
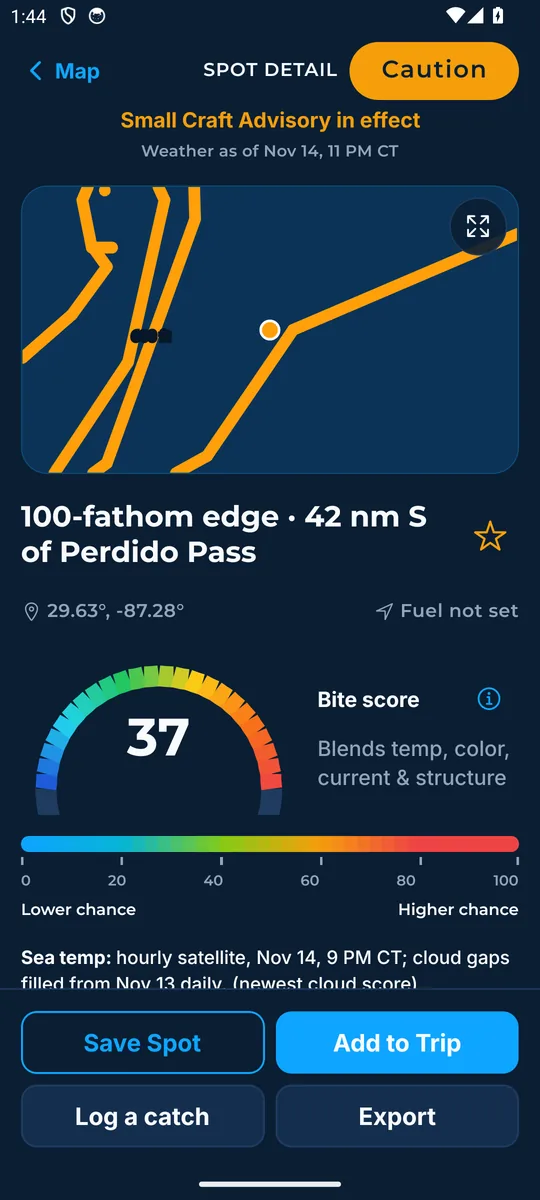
Spot screen
Everything about one spot: readings, the bite score, save, add to trip, log a catch and export.
Routes
Let the app build a run using estimated fuel and time, or pick the stops yourself.
Build a route
Let the app order the stops for you, or pick your own. Include rigs if you want them.
Plan: fuel, time and stops
Distance, run time, fuel and the clock for your trip, with stops you can reorder.
Open a run (the trip sheet)
The trip sheet's main button, the sea conditions badge, and bearing and ETA to the next stop.
Boat & export
Your boat on the chart, your boat's numbers, starts, and GPX for the plotter.
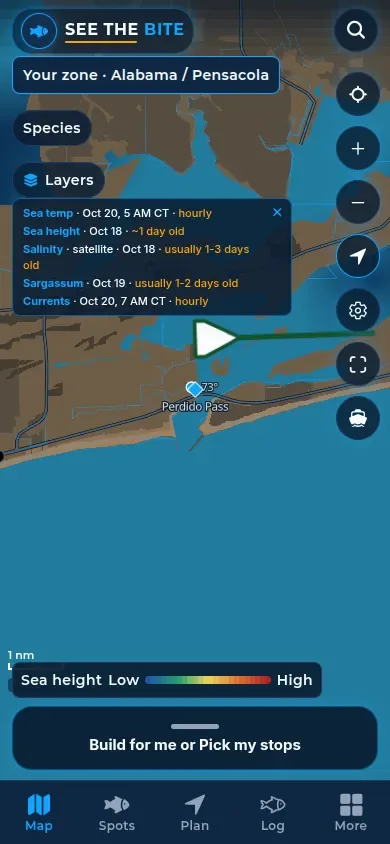
Where you are (GPS boat dot)
Your boat on the chart, with bearing and ETA to the next stop.
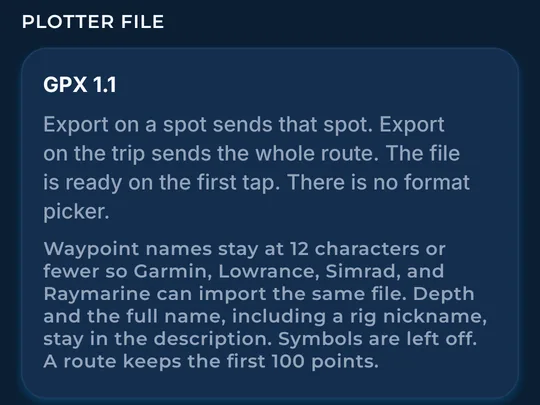
Export GPX to your plotter
Send a spot, your saved spots, or the first 100 points of a route to Garmin, Simrad and other plotters.
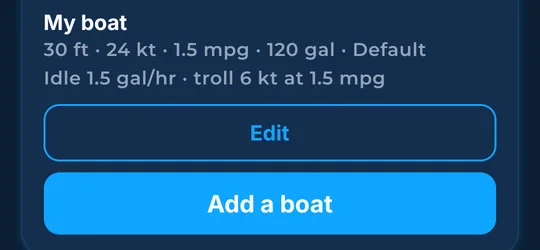
Your boat
Tell the app about your boat: speed, fuel burn, tank, reserve, and your sea and wind limits.
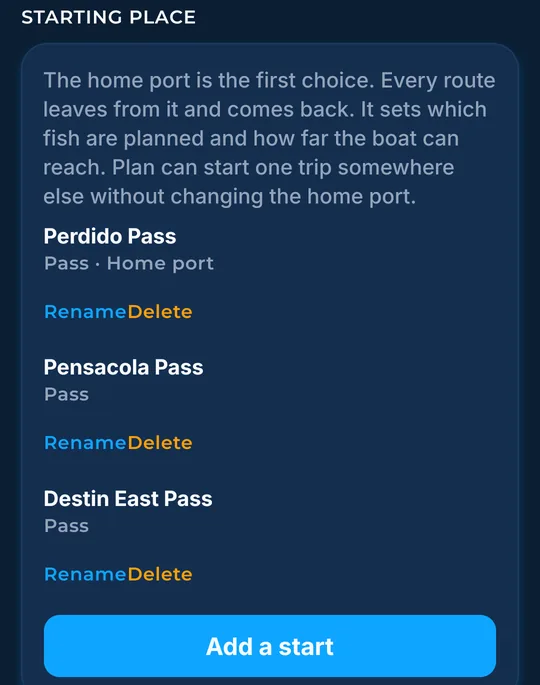
Starts and home port
Where every trip leaves from: your home port and any extra starts you add.
More (settings)
Downloads, units, the catch log, help, and the rest of the More tab.
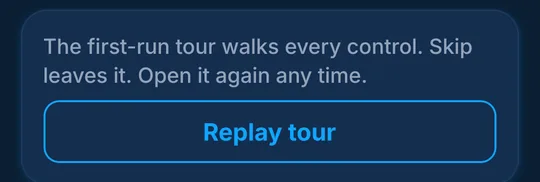
The tour (Replay tour)
The first-run tour walks every control. Replay it any time from More.
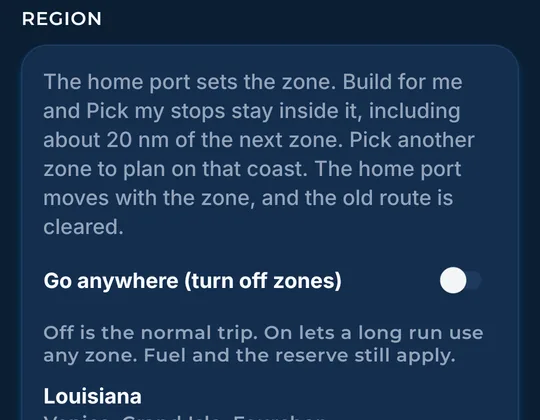
Zones and Go anywhere
See how zone boundaries affect route planning across launch waters from Texas to New England.
Home region and downloads
Pick your home coast and manage what is downloaded on the phone.
Offline maps: water saved on the phone
See what ocean data is saved on your phone, and refresh it before you leave the dock.
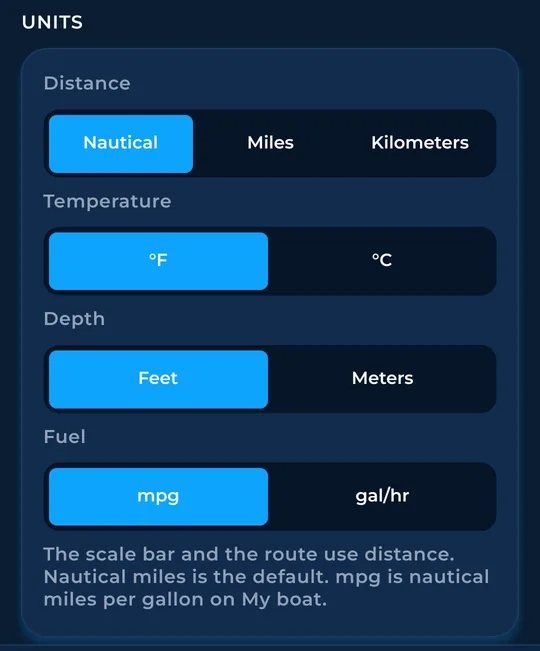
Units
Nautical miles, miles or kilometers; °F or °C; feet or meters; mpg or gal/hr.
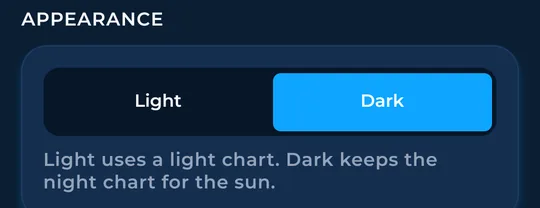
Light or Dark
Pick a light chart for bright sun, or keep the dark night chart.
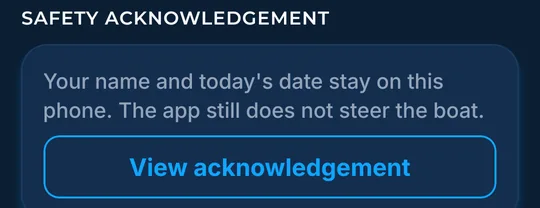
Safety acknowledgement
Read the safety page you agreed to, saved on this phone.
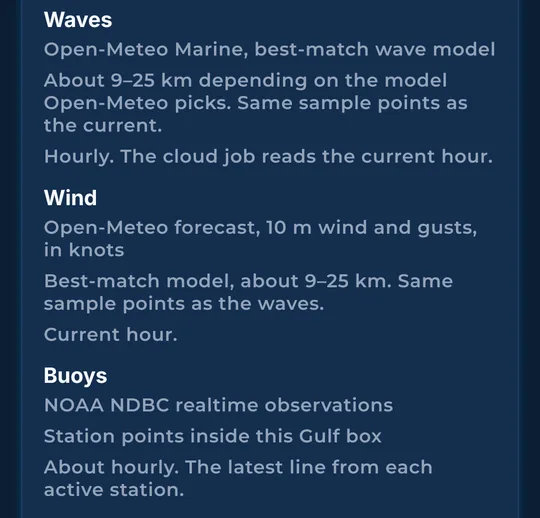
Data sources
Sources for the maps, ocean layers and forecasts.
Rate and support
Leave a rating, or send a note to support from inside the app.
Catch log
Log each catch with the fish, details and photos, plus the water at that moment.
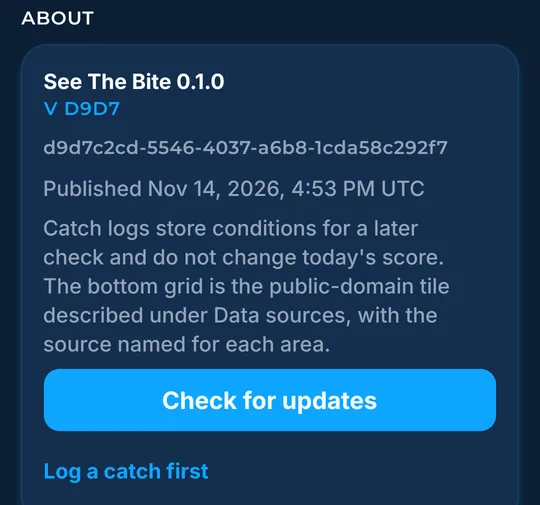
About this phone: version and updates
Check the app version, look for updates, and share your catch file.