
Layer · lines and marks
Temperature breaks
Marks where the water temperature changes sharply, where different water meets.
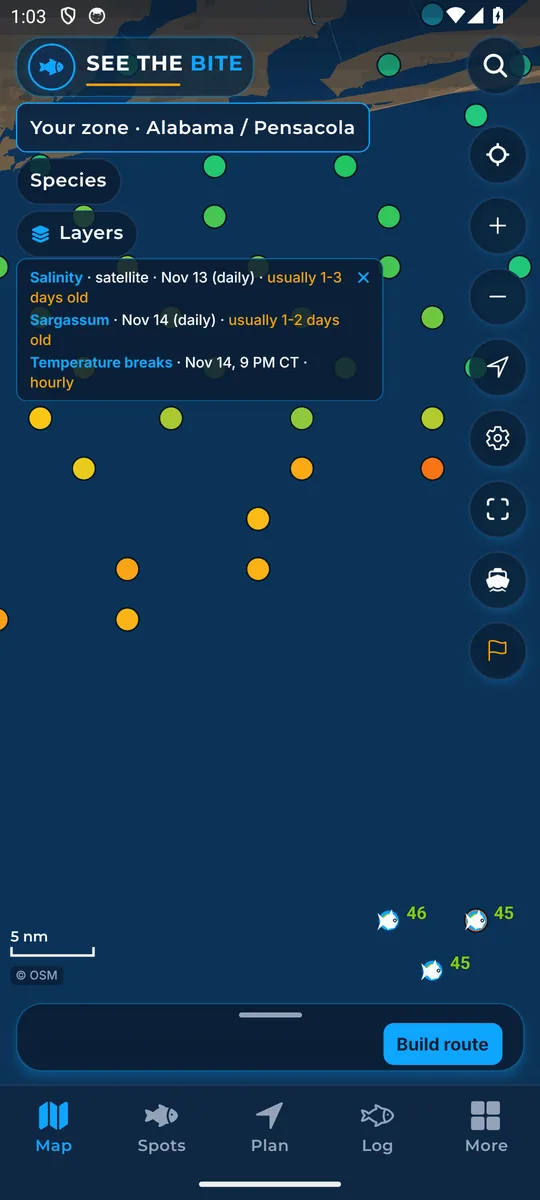
What it shows
Lines mark a strong change in water temperature, where different water meets. Their colors follow the sea-temp range you set.
Where the data comes from
Computed from the published temperature field, so it is the same age as that field.
How to turn it on
- Tap Layers, then More layers.
- Tap the Temperature breaks switch.
How to use it
- Follow an edge and check for bait before stopping.
- Breaks near structure, rigs or a current edge are worth a closer look.
In the app tour
Tour step 23 of 67 · Layers · Temperature breaks
Temperature breaks marks sharp edges. Tap the switch. Their colors follow the sea-temp range you set.
See this step in the full tutorial →
Related
Every layer is included
One subscription opens every layer and feature. Founders get the first year for $80. See ordering and prices or give a year as a gift.
App Store coming soonGoogle Play coming soon
See The Bite is coming to the App Store and Google Play. The store links are not live yet.