
One color field and the legend
Why some layers replace each other, and how to tuck the legend strip away.

What it shows
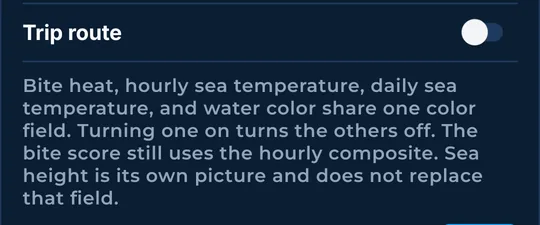
Bite heat, hourly sea temperature, daily sea temperature and water color (chlorophyll) share one color field. Only one of them can paint the chart at a time. The key under the layer list names each mark that is on. A legend strip on the map shows the scale for the color picture, with its as-of line.
How to turn it on
- The rule note and the key are at the bottom of the More layers sheet.
- The legend strip shows on the map when a color picture is on.
How to use it
- Turn on a different color picture and the old one turns off by itself.
- Sea height is its own picture, so it does not replace the temperature field.
- Tap Close legend (the ×) to tuck the strip into the trip sheet. Sea height, bite heat and chlorophyll all use the same strip and the same ×.
In the app tour
Tour step 32 of 67 · Layers · One color field
This note is the rule: bite heat, hourly sea temperature, daily sea temperature, and water color share one color field. The key under the list names each mark that is on.
Tour step 35 of 67 · Layers · Close legend
This strip is the sea-height scale from low to high, with its as-of line. Tap Close legend, the ×, to tuck it into the trip sheet. Bite heat and chlorophyll use that same strip and the same ×.
See this step in the full tutorial →
Related
Every layer is included
One subscription opens every layer and feature. Founders get the first year for $80. See ordering and prices or give a year as a gift.
See The Bite is coming to the App Store and Google Play. The store links are not live yet.