
Data sources
Sources for the maps, ocean layers and forecasts.
What it shows
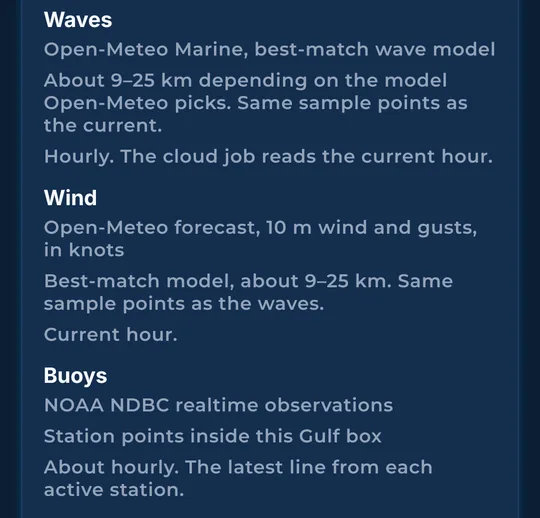
Sources include NOAA hourly satellite sea temperature (typically 2 to 6 hours old), NOAA’s daily temperature blend and CoastWatch daily current analysis, NOAA National Data Buoy Center observations (usually hourly), Open-Meteo hourly wind and marine forecasts, and U.S. Bureau of Ocean Energy Management (BOEM) platform records. Bottom data combines NOAA hydrographic surveys and coastal grids, USGS CoNED, and BOEM’s deepwater grid. Platform and bottom data reflect the source release or survey date.
How to find it
- In More, scroll to Data sources.
How to use it
- Read where each layer comes from, like NOAA satellites, NOAA buoys and Open-Meteo weather models.
- Use it with the as-of times to judge how much to trust a picture.
In the app tour
Tour step 64 of 67 · More (settings) · Data sources
Sources include NOAA hourly satellite sea temperature (typically 2 to 6 hours old), NOAA’s daily temperature blend and CoastWatch daily current analysis, NOAA National Data Buoy Center observations (usually hourly), Open-Meteo hourly wind and marine forecasts, and U.S. Bureau of Ocean Energy Management (BOEM) platform records. Bottom data combines NOAA hydrographic surveys and coastal grids, USGS CoNED, and BOEM’s deepwater grid. Platform and bottom data reflect the source release or survey date.
See this step in the full tutorial →
Related
Every layer is included
One subscription opens every layer and feature. Founders get the first year for $80. See ordering and prices or give a year as a gift.
See The Bite is coming to the App Store and Google Play. The store links are not live yet.